Commercial real estateSEOContent
60 clicks in March. 97 in August. Six months.
The SQFT Group is a commercial real estate brokerage with roots in healthcare property, working across New York, New Jersey, Connecticut, Massachusetts and Rhode Island. It onboarded with us on 11 December 2025. Between March and August 2026, monthly clicks from Google rose from 60 to 97, monthly impressions doubled from 7,452 to 14,960, and keywords ranking in the top 10 went from 82 to 137. This page covers those six months, March to August 2026.
August 2026 monthly clicks
97
The last full month in the measured window.
March 202660
- Client
- The SQFT Group
- Sector
- Commercial real estate
- Work
- SEO + content
- Onboarded
- 11 Dec 2025
- Measured
- Mar 26 – Aug 26
WHERE IT STARTED
Specialist expertise, little search visibility
Search Console data for thesqftgroup.com starts on 2 February 2026, so March 2026 is the first full month on record. That month the site recorded 60 clicks from 7,452 impressions. The keyword baseline below uses the first 90 days of the window, 1 March to 29 May 2026.
The verified starting point
The search baseline
- Clicks, March 2026
- 60
- Impressions, March 2026
- 7,452
- Clicks, first 90 days
- 154
- Top 10 keywords, first 90 days
- 82
- Top 3 keywords, first 90 days
- 12
- ProblemClicks in double figures.60 clicks in a month is about two a day, for a brokerage working across five states.
- ProblemFew keywords on page one.Across the first 90 days, 82 queries ranked the site in the top 10, and only 12 of them in the top three.
- ProblemNo blog at onboarding.In December 2025 the client told us the site had no blog, and that they wanted one.
- ProblemMore than healthcare to cover.At onboarding the client described a healthcare and dental core, plus team members covering retail, bar and restaurant, office and industrial property.
THE RESULT
Six months, six numbers
Every figure comes from Google Search Console for thesqftgroup.com. Nothing modelled, nothing extrapolated.
- Clicks per month01 / 0697August 2026, from 60 in March 2026
- Impressions per month02 / 0614,960August 2026, from 7,452 in March 2026
- Clicks per quarter03 / 06256June to August 2026, from 158 in March to May
- Keywords in the top 1004 / 06137from 82, most recent 90 days against the first 90
- Keywords in the top 305 / 0646from 12, across the same two 90-day windows
- Six-month total06 / 06414clicks, from 49,455 impressions
The month it turned
Clicks nearly doubled in June
The site recorded 46 clicks in May 2026 and 88 in June. July and August followed at 71 and 97, both above 60, the highest month from March to May. That step is the clearest single shift in the record.
May 2026
46
June 2026
88
MONTH BY MONTH
The full arc
Two measures, two charts. Clicks and impressions sit on very different scales, so putting them on one axis would flatten one of them.
97Aug 26
14,960Aug 26
SEARCH FOOTPRINT
From 82 top 10 keywords to 137
Clicks are the outcome. Page-one rankings grew alongside them. This compares the first 90 days of the measured window against the most recent 90, in Search Console data.
Keywords in the top 10
1.7× more82137
In the top 3
46
In positions 4 to 10
91
Clicks per 90 days
250
A separate unit from the keyword bars: clicks recorded inside each 90-day window.
The keyword measures share one scale, with 137 as the widest measure. Clicks are shown separately. Keyword counts are Search Console data read through Ahrefs, whose copy for this site runs to 30 August 2026, and include every distinct query Google recorded, many with a single impression. First 90 days: 1 March to 29 May 2026. Most recent 90: 2 June to 30 August 2026.
The website
See the site behind the numbers
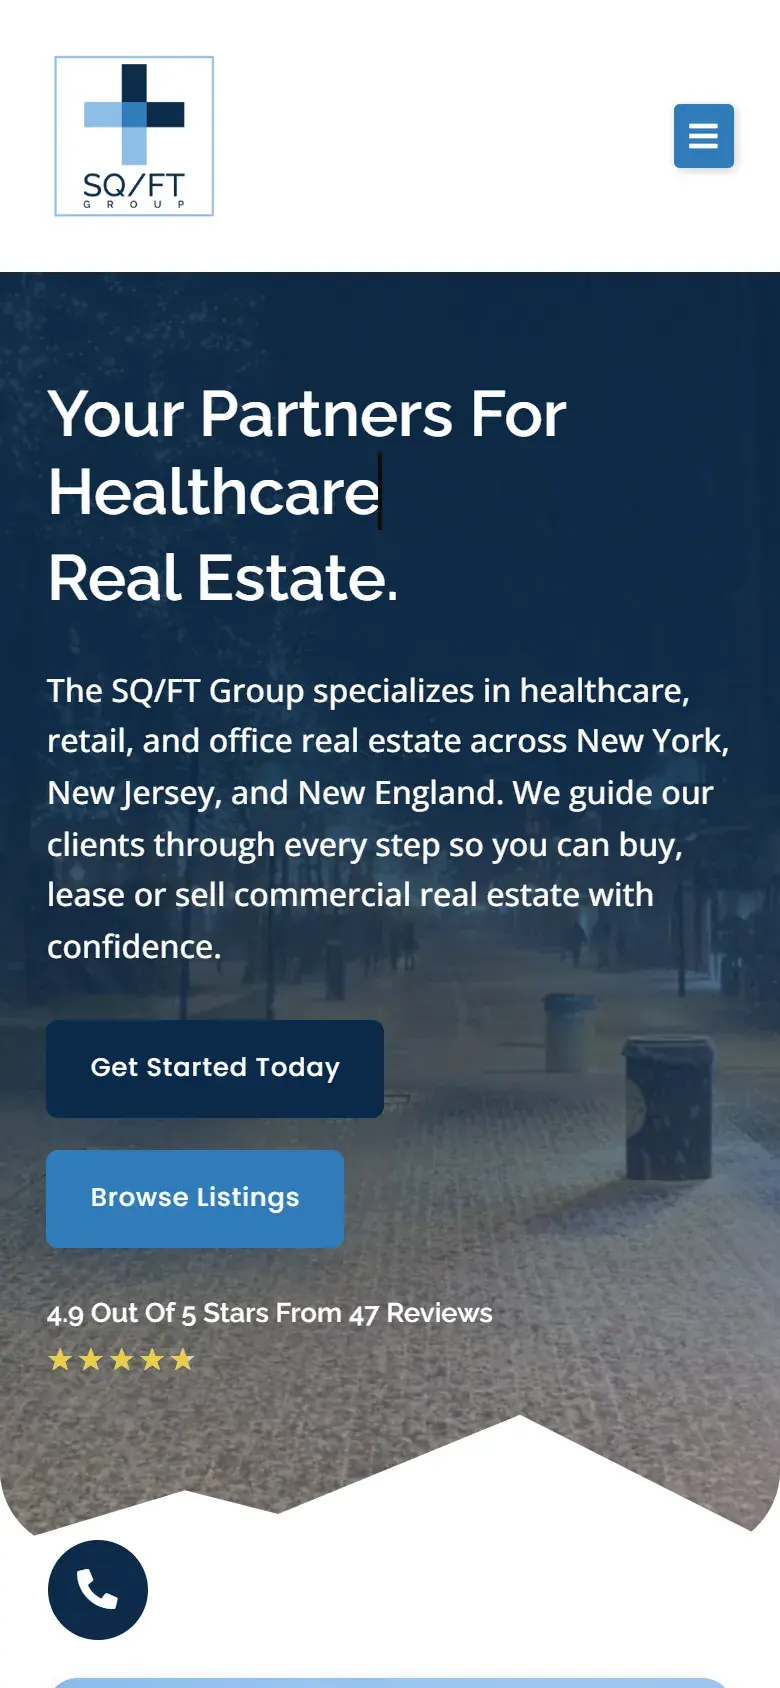
Every result in this case study was measured on thesqftgroup.com. This is its homepage on desktop and on a phone.
Visit thesqftgroup.com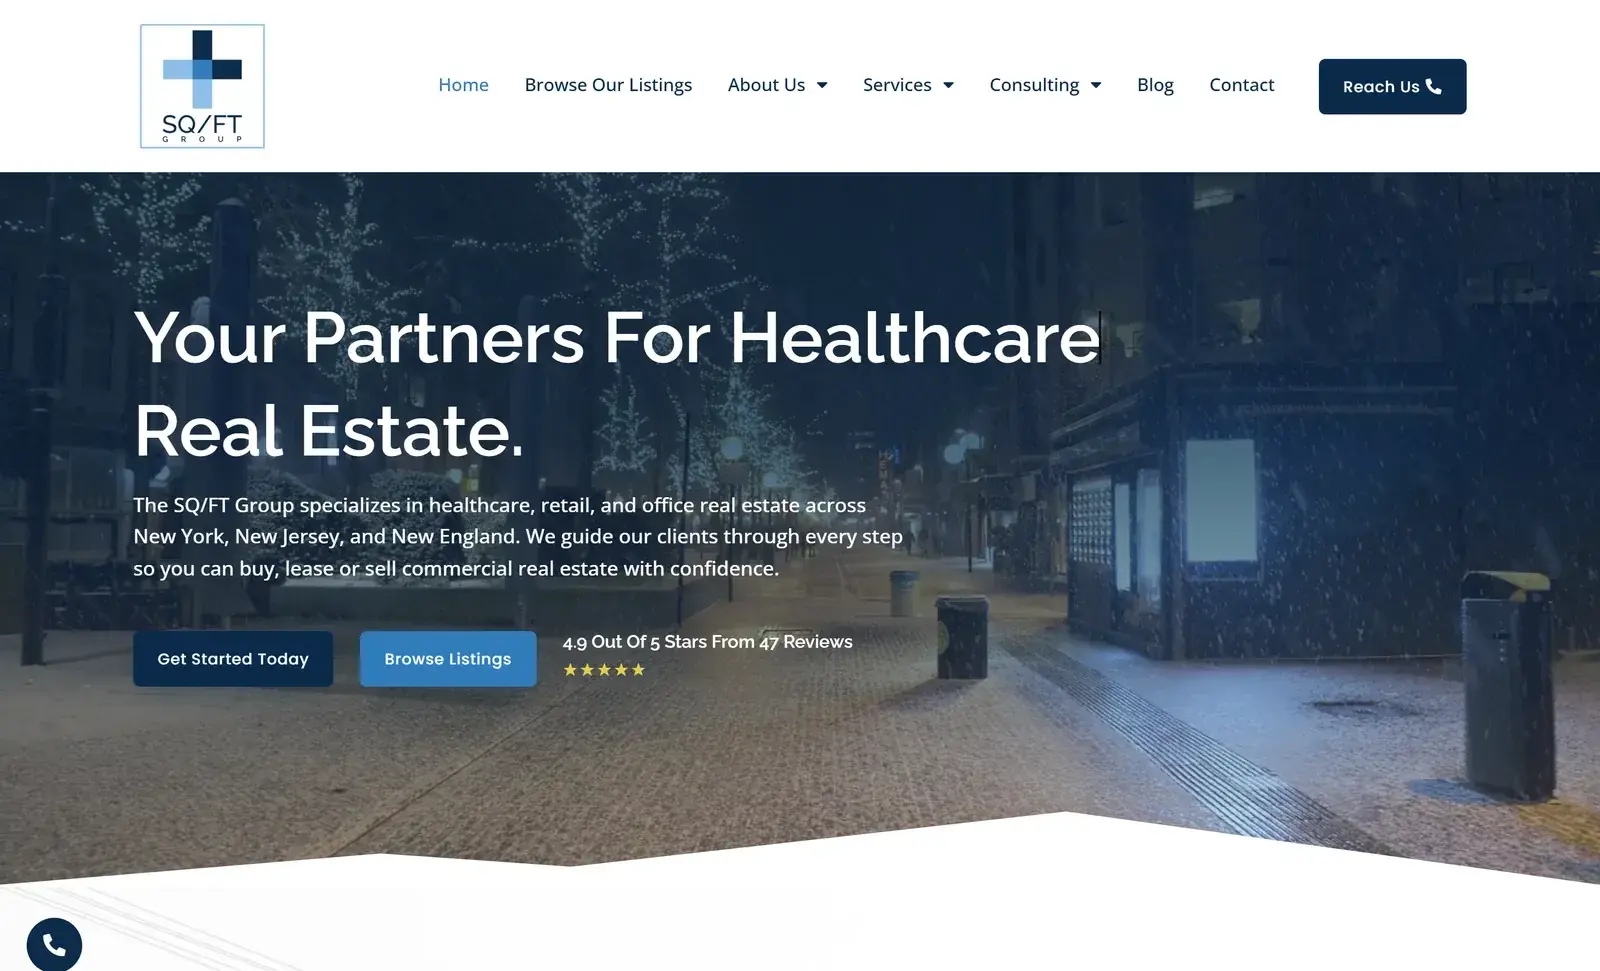
THE WORK
A healthcare content base. Then a consulting hub.
Taken from our project records and the client’s onboarding questionnaire. The records list what was in place by the July 2026 report rather than a dated log of each task, so the work is not lined up against particular months above.
- 01From December 2025
Onboarding and strategy
- Onboarding questionnaire completed on 11 December 2025
- Brokerage pages held to the five states the firm serves: New York, New Jersey, Connecticut, Massachusetts and Rhode Island
- Market review: state and practice-type pages identified as the gap to fill
- Content pillars set around the practice lifecycle: lease negotiation, build-out, costs and relocation
- Blog voice agreed at onboarding: professional and authoritative
82 → 137keywords in the top 10, first 90 days of the window against the most recent 90 - 02By July 2026
Guides, location pages and a consulting hub
- 7 dental practice guides, from build-out cost per square foot to tenant improvement allowances
- 12 medical practice guides, covering lease length, NNN leases, CAM charges, zoning and parking
- 15 location pages: dental, healthcare and veterinary for each of the five states
- Consulting hub in build by August 2026: a national commercial real estate pillar with retail, office, industrial and healthcare pages
- White-label Search Console and Bing performance reporting
158 → 256clicks, March to May 2026 against June to August 2026
THE FULL RECORD
Month by month
Every full month in the window, as Search Console recorded it.
| Month | Clicks | Impressions |
|---|---|---|
| Mar 26 Baseline | 60 | 7,452 |
| Apr 26 | 52 | 6,551 |
| May 26 | 46 | 5,145 |
| Jun 26 Step up | 88 | 7,851 |
| Jul 26 | 71 | 7,496 |
| Aug 26 | 97 | 14,960 |
Search Console data for thesqftgroup.com starts on 2 February 2026, so February is a partial month and sits outside this page. This page covers March to August 2026 only.
What it added up to
From 60 clicks a month to 97, with every month accounted for
- 01 / 04Clicks up 62%August 2026 brought 97 clicks against 60 in March. In three-month blocks, June to August totalled 256 against 158 for March to May.
- 02 / 04Twice the impressionsMonthly impressions went from 7,452 in March to 14,960 in August. June to August totalled 30,307, against 19,148 for March to May.
- 03 / 04More of page one137 keywords ranked in the top 10 in the most recent 90 days, against 82 in the first 90. 46 of them sat in the top three, up from 12.
- 04 / 04Measured the whole wayEvery figure here comes from Google Search Console for March to August 2026. No modelling, no projections.
Your turn
Not sure whether your site is the constraint, or the content is?
We will pull your Search Console data, show you which pages are close to moving and which ones never will, and hand you the list. Free, and yours to keep whether you work with us or not.
Where the numbers come from
Figures: Google Search Console for thesqftgroup.com, March to August 2026, keyword counts from the same Search Console data via Ahrefs, and Webtec project records.
- Clicks per month
- 97
- Impressions per month
- 14,960
- Clicks per quarter
- 256
- Keywords in the top 10
- 137
More case studies