Electric UTV partsSEOContent
3,323 summer clicks in 2025. 4,257 in 2026. Same three months.
Bad Boy Recoil Parts is a Shopify store selling replacement parts and lithium battery conversion kits for electric utility vehicles from a manufacturer that, in the client’s words, is out of business. Demand is seasonal, so the fair test is the same months a year apart. We onboarded the account for SEO on 26 November 2025. From June to August 2026, Google clicks were 28% higher than in the same three months of 2025. Here is every month from 1 June 2025 to 31 August 2026.
June to August 2026 clicks
4,257
Summer 2026, the last three full months in the reporting window.
June to August 20253,323
- Client
- Bad Boy Recoil Parts
- Sector
- Electric UTV parts
- Work
- SEO + content
- Onboarded
- 26 Nov 2025
- Measured
- Jun 25 – Aug 26
WHERE IT STARTED
A seasonal store with a narrow footprint
From June to August 2025, before SEO onboarding, badboyrecoilparts.com earned 3,323 Google clicks from 47,946 impressions. The keyword baseline below uses the first 90 days on Google’s current counting basis, 16 September to 14 December 2025.
The verified starting point
The search baseline
- Clicks, June to August 2025
- 3,323
- Impressions, June to August 2025
- 47,946
- Keywords ranking, first 90 days
- 399
- Page one keywords, first 90 days
- 155
- Top 3 keywords, first 90 days
- 46
- ProblemA specialist line with no maker behind it.At onboarding the client told us the parts they support are for a company that is out of business, and that they specialise in that one product line. The store covers the Recoil, Ambush, Instinct, XTO, Tracker EV and Express 4×4 models.
- ProblemDemand that moves with the seasons.By the client’s own account, autumn is busy and winter is quiet. That is why this page compares the same months a year apart.
- ProblemNo blog yet.At onboarding on 26 November 2025 the client told us there was no blog on the site, and that they wanted one.
- ProblemFew searches in the top three.Across the first 90 days, 399 queries returned the site anywhere in search, and 46 of them in the top three.
THE RESULT
One year apart, six numbers
Every figure comes from Google Search Console for badboyrecoilparts.com, with keyword counts taken from the same data via Ahrefs. Nothing modelled, nothing extrapolated.
- Clicks, June to August01 / 064,257in 2026, from 3,323 in the same three months of 2025, up 28%
- Clicks, August02 / 061,544August 2026, from 1,235 in August 2025
- Impressions, June to August03 / 0655,561in 2026, from 47,946 a year earlier
- Ranking keywords04 / 06887most recent 90 days, from 399 in the first 90
- Keywords on page one05 / 06469from 155 in the first 90 days
- Keywords in the top 306 / 06252from 46 in the first 90 days
Year on year
Every summer month beat the year before
June 2026 brought 1,270 clicks against 1,027 a year earlier. July brought 1,443 against 1,061, and August 1,544 against 1,235. Through 2026, clicks also rose every month, from 755 in January to 1,544 in August. Part of that climb is the calendar. The year-on-year comparison takes the calendar out.
Before SEO
Jun – Aug 2025
3,323
Jun – Aug 2026
4,257
MONTH BY MONTH
The full arc
Two measures, two charts. Clicks and impressions sit on very different scales, so putting them on one axis would flatter the story.
1,544Aug 26
20,367Aug 26
SEARCH FOOTPRINT
From 399 keywords to 887
Clicks are the outcome. The search footprint widened alongside them. This compares the first 90 days on Google’s current counting basis against the most recent 90, measured in Search Console.
Keywords ranking
2.2× more399887
On page one
469
In the top 3
252
Clicks per 90 days
4,096
A separate unit from the keyword bars: all Search Console clicks recorded inside each 90-day window.
The three keyword measures share one scale, with 887 as the widest measure. Clicks are shown separately. First 90 days: 16 September to 14 December 2025, which includes the client’s busier autumn months. Most recent 90: 26 May to 23 August 2026, the last day in Ahrefs’ Search Console sync. Page one means an average position of 10 or better, top 3 an average position of 3 or better. Both windows start after Google’s mid-September 2025 reporting change. Search Console data via Ahrefs.
The website
See the site behind the numbers
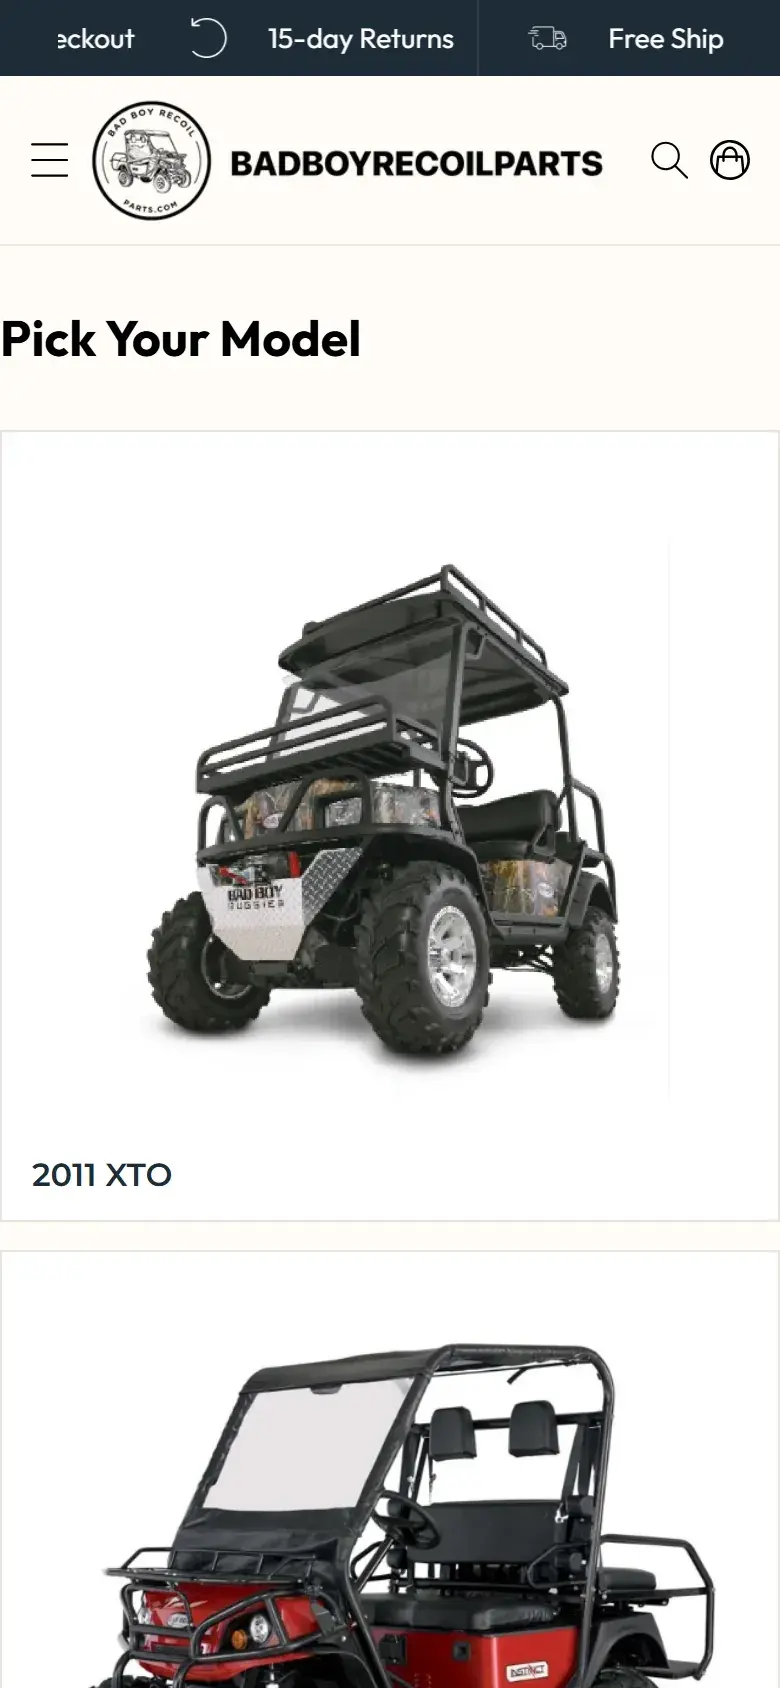
Every result in this case study was measured on badboyrecoilparts.com. This is its homepage on desktop and on a phone.
Visit badboyrecoilparts.com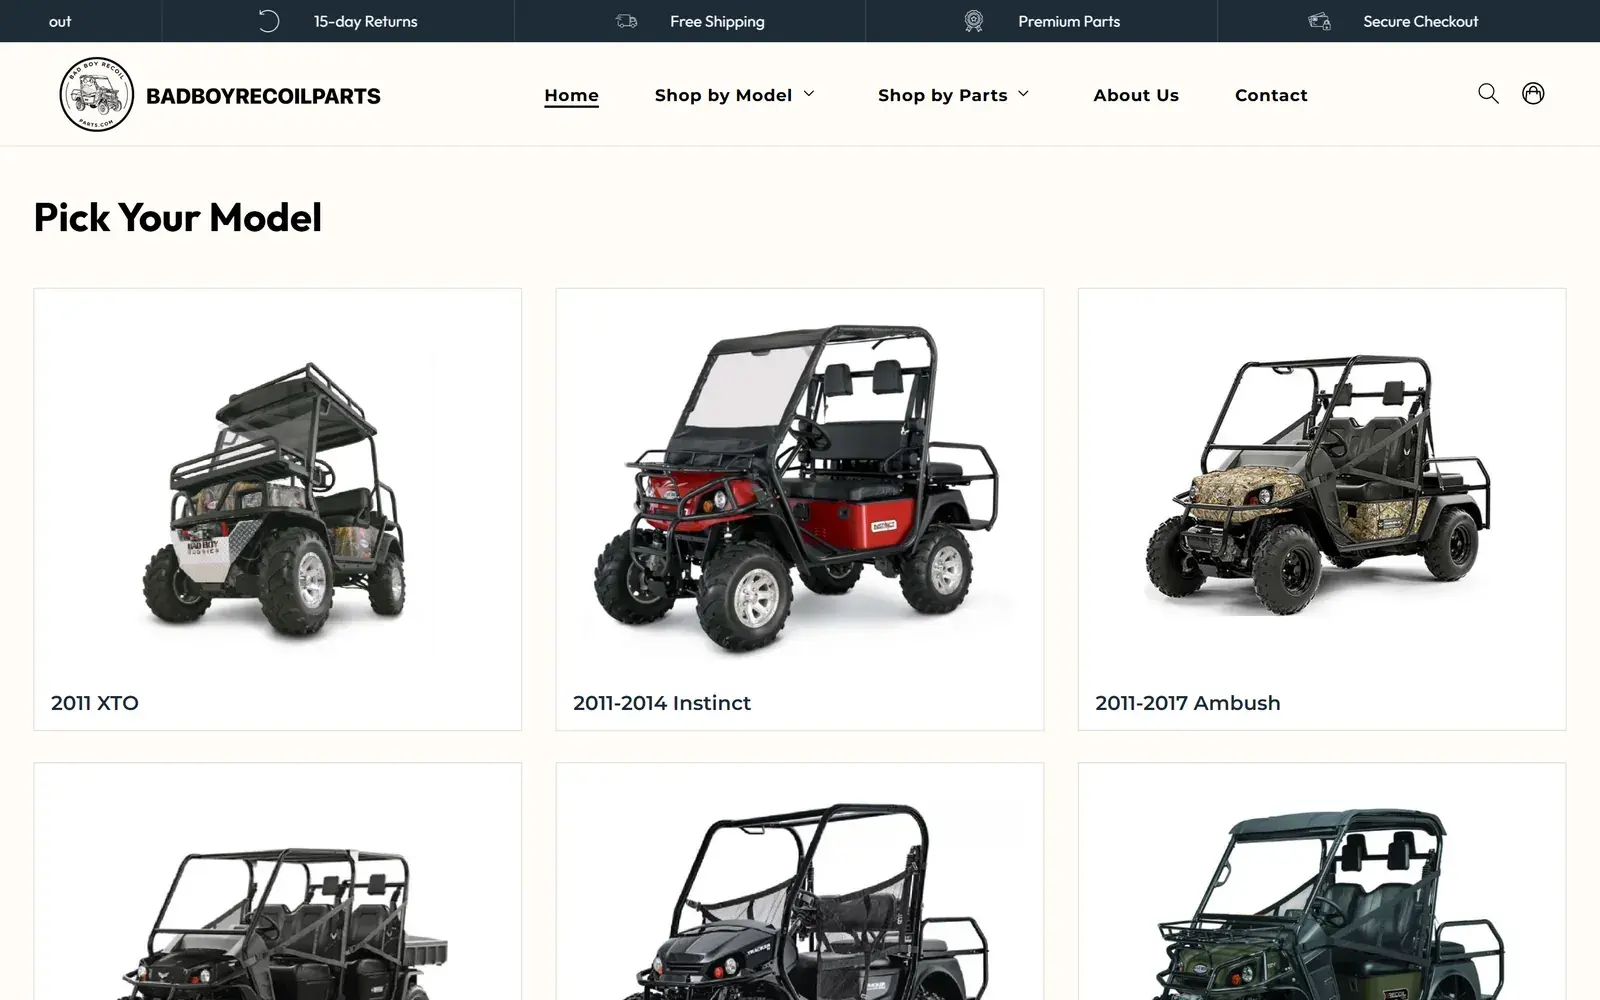
THE WORK
Collections first. Then symptom-led content.
Taken from our project records. They record scope, plans and deliverables rather than a dated task log, so this is what they support and no more.
- 01From Nov 2025
Onboarding and collection architecture
- Onboarding questionnaire 26 November 2025: lithium conversion kits and brake parts named as key product lines
- Full product inventory analysed before any new collection was proposed
- Four-tier collection plan: brand, model, part type, and model plus part
- 208 collections in the plan, 178 of them new, each mapped to real product URLs
- Rollout from the new-collection backlog ongoing
1,141 → 1,793clicks to collection pages, Search Console’s last three months against the three before, exported 31 July 2026 - 02Content and reporting
Symptom-to-part articles
- About sixteen noise and symptom searches assessed and ranked in three tiers, starting with those that lead straight to one part
- One pattern for every article: symptom, likely cause, how to confirm it, then the exact part with a link
- Seven troubleshooting articles live by the July 2026 report, from clicking on acceleration to a battery that dies overnight
- Reporting across Google, Bing and AI citations, with clicks as the primary measure
399 → 887keywords ranking, first 90 days against the most recent 90
THE FULL RECORD
Month by month
Fifteen full months from Search Console. Where a month has a year-earlier match in the data, it sits alongside.
| Month | Clicks | Impressions | Clicks a year earlier |
|---|---|---|---|
| Jun 25 | 1,027 | 16,114 | – |
| Jul 25 | 1,061 | 15,327 | – |
| Aug 25 | 1,235 | 16,505 | – |
| Sep 25 Google change | 1,416 | 16,464 | – |
| Oct 25 | 1,559 | 16,153 | – |
| Nov 25 Onboarded 26 Nov | 1,083 | 12,374 | – |
| Dec 25 | 726 | 7,498 | – |
| Jan 26 | 755 | 8,426 | – |
| Feb 26 | 910 | 10,345 | – |
| Mar 26 | 1,014 | 12,945 | – |
| Apr 26 | 1,182 | 16,979 | – |
| May 26 | 1,198 | 17,120 | – |
| Jun 26 | 1,270 | 18,358 | 1,027 |
| Jul 26 | 1,443 | 16,836 | 1,061 |
| Aug 26 | 1,544 | 20,367 | 1,235 |
Window: 1 June 2025 to 31 August 2026. Search Console data for the site starts on 20 May 2025, so year-earlier figures exist from June 2026. Google stopped serving 100 results per page in mid-September 2025. Impressions before that point are not directly comparable with the months after it. Clicks were not affected in the same way.
What it added up to
From 3,323 summer clicks to 4,257, with every month accounted for
- 01 / 04Every summer month upJune, July and August 2026 each beat the same month of 2025, by 24%, 36% and 25%. Across the three months together, clicks rose 28%.
- 02 / 04A wider, deeper footprintThe site appeared for 887 keywords in the most recent 90-day window, against 399 in the first 90 on Google’s current counting. 252 of them now sit in the top three, against 46.
- 03 / 04Collections carried more of the loadCollection pages drew 1,793 clicks in the last three months of a Search Console comparison exported 31 July 2026, against 1,141 in the three months before. The axles collection went from 64 to 154. The timing is the signal here, not a claim of causation.
- 04 / 04Measured the whole wayEvery Google figure here comes from Search Console, and every month in the window is in the table. Bing figures are labelled as Bing. No modelling, no projections.
Your turn
Not sure whether your store’s collections match the way buyers search?
We will pull your Search Console data, show you which pages are close to moving and which ones never will, and hand you the list. Free, and yours to keep whether you work with us or not.
Where the numbers come from
Figures: Google Search Console for badboyrecoilparts.com, 1 June 2025 to 31 August 2026, Search Console keyword data via Ahrefs to 23 August 2026, Bing Webmaster Tools AI performance data from 31 January to 28 July 2026, and Webtec project records.
- Clicks, June to August
- 4,257
- Clicks, August
- 1,544
- Impressions, June to August
- 55,561
- Ranking keywords
- 887
More case studies