Podcast and video productionSEOWebsite + SEOContent
34 clicks in August 2025. 114 a year later.
Humanise Live produces podcasts, video and live events for purpose-driven organisations. We onboarded them in July 2025, look after the website and run the search content plan. Monthly clicks went from 34 in August 2025 to 114 in August 2026, and every full month since March 2026 has passed 100. Here is every month of it, including the month Google changed how it counts.
August 2026 monthly clicks
114
The latest full month in the reporting window.
August 2025, same month a year earlier34
- Client
- Humanise Live
- Sector
- Podcast and video production
- Work
- Website + SEO content
- Onboarded
- 17 July 2025
- Measured
- Aug 25 – Aug 26
WHERE IT STARTED
Barely visible in search
Search Console’s record for humanise.live starts on 20 July 2025. In August 2025, the first full month, the site earned 34 clicks from 437 impressions at an average position of 40.1. That is page four. Part of that reading came from how Google counted impressions at the time, which changed in September 2025, so wherever it matters we compare like with like. The 90-day figures below start on 15 September 2025, after that change.
The verified starting point
The search baseline
- Avg position, Aug 2025
- 40.1
- Clicks, Aug 2025
- 34
- Impressions, Aug 2025
- 437
- Clicks, first 90 days after the change
- 63
- Impressions, first 90 days after the change
- 2,632
- ProblemVery little reach.437 impressions in a full month is about 14 a day. Before anything else, the site needed to be shown for more searches.
- ProblemThe yardstick moved mid-record.In mid-September 2025 Google stopped serving 100 results per page, which changed how impressions and position are counted. On numbers this small the effect is hard to isolate: impressions went from 123 in the week of 8 September to 65 in the week of 15 September, with clicks at 6 then 4. We treat that as a reporting change, not a result.
- ProblemNo content library yet.At onboarding the blog had not launched. It was to be launched with us, so there were no articles answering the questions buyers search for.
- ProblemA clean slate.By the client’s own account at onboarding, no SEO or marketing agency had worked on the site before.
THE RESULT
August to August, six numbers
Every figure comes from Google Search Console for humanise.live. Clicks are compared August to August. Where Google’s September 2025 counting change would flatter a comparison, we compare like with like. Nothing modelled, nothing extrapolated.
- Clicks per month01 / 06114from 34 in August 2025, the same month a year earlier
- Impressions per month02 / 0631,766August 2026, from 511 in October 2025, the first full month after Google’s change
- Clicks per 90 days03 / 06338from 63 in the first 90 days after Google’s change
- Impressions per 90 days04 / 0691,620from 2,632 in the first 90 days after Google’s change
- Months over 100 clicks05 / 066every full month from March to August 2026, none before
- Last six full months06 / 06769clicks, from 154 in the first six full months
The month it turned
Clicks passed 100 in March 2026
Clicks were 58 in February 2026 and 107 in March, the first month above 100. Every full month since has stayed above it. In the same step average position moved from 11.2 to 8.4 and impressions from 10,498 to 26,722. The shift coincided with the keyword library work set out below.
February 2026
58
First 100+
March 2026
107
MONTH BY MONTH
The full arc
Two measures, two charts. Clicks and position sit on different scales, so putting them on one axis would flatter the story.
114Aug 26
11.4Aug 26
SEARCH FOOTPRINT
From 29 impressions a day to 1,018
Clicks are the outcome. Reach widened well ahead of them. This compares the first 90 days after Google’s September 2025 change against the most recent 90, so both windows are counted the same way.
Impressions per day
35× more291,018
Average position
10.8
Impressions per 90 days
91,620
Clicks per 90 days
338
A separate unit from reach: clicks recorded inside each 90-day window.
Position is impression-weighted across each window. Impressions per day is the 90-day total divided by 90. First 90 days: 15 September to 13 December 2025. Most recent 90: 22 June to 19 September 2026. Keyword-level counts were not available for this property, so this section measures the footprint in impressions rather than ranking keywords.
The website
See the site behind the numbers
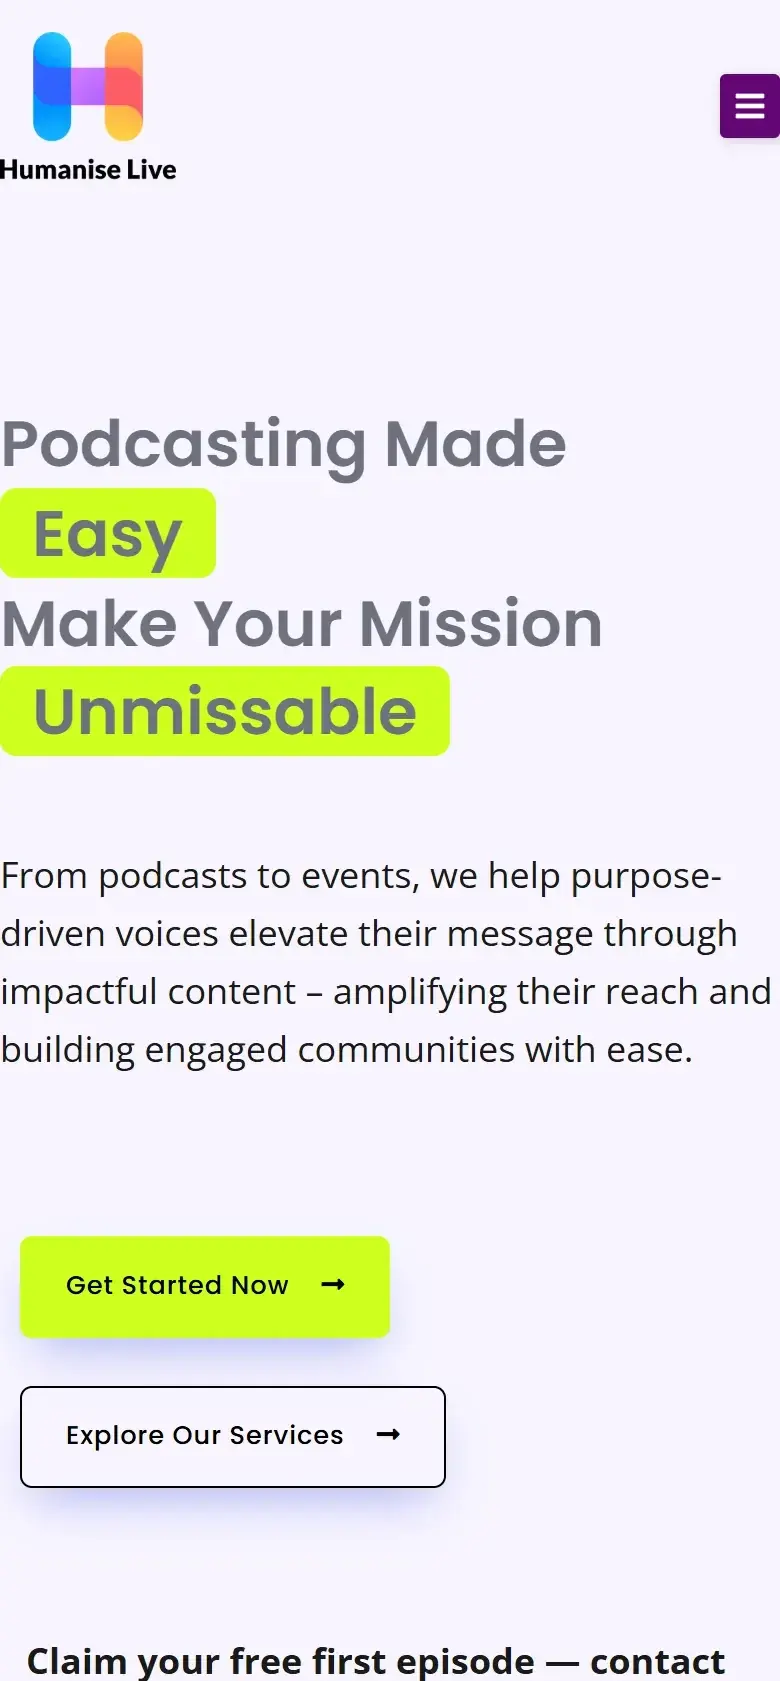
Every result in this case study was measured on humanise.live. This is its homepage on desktop and on a phone.
Visit humanise.live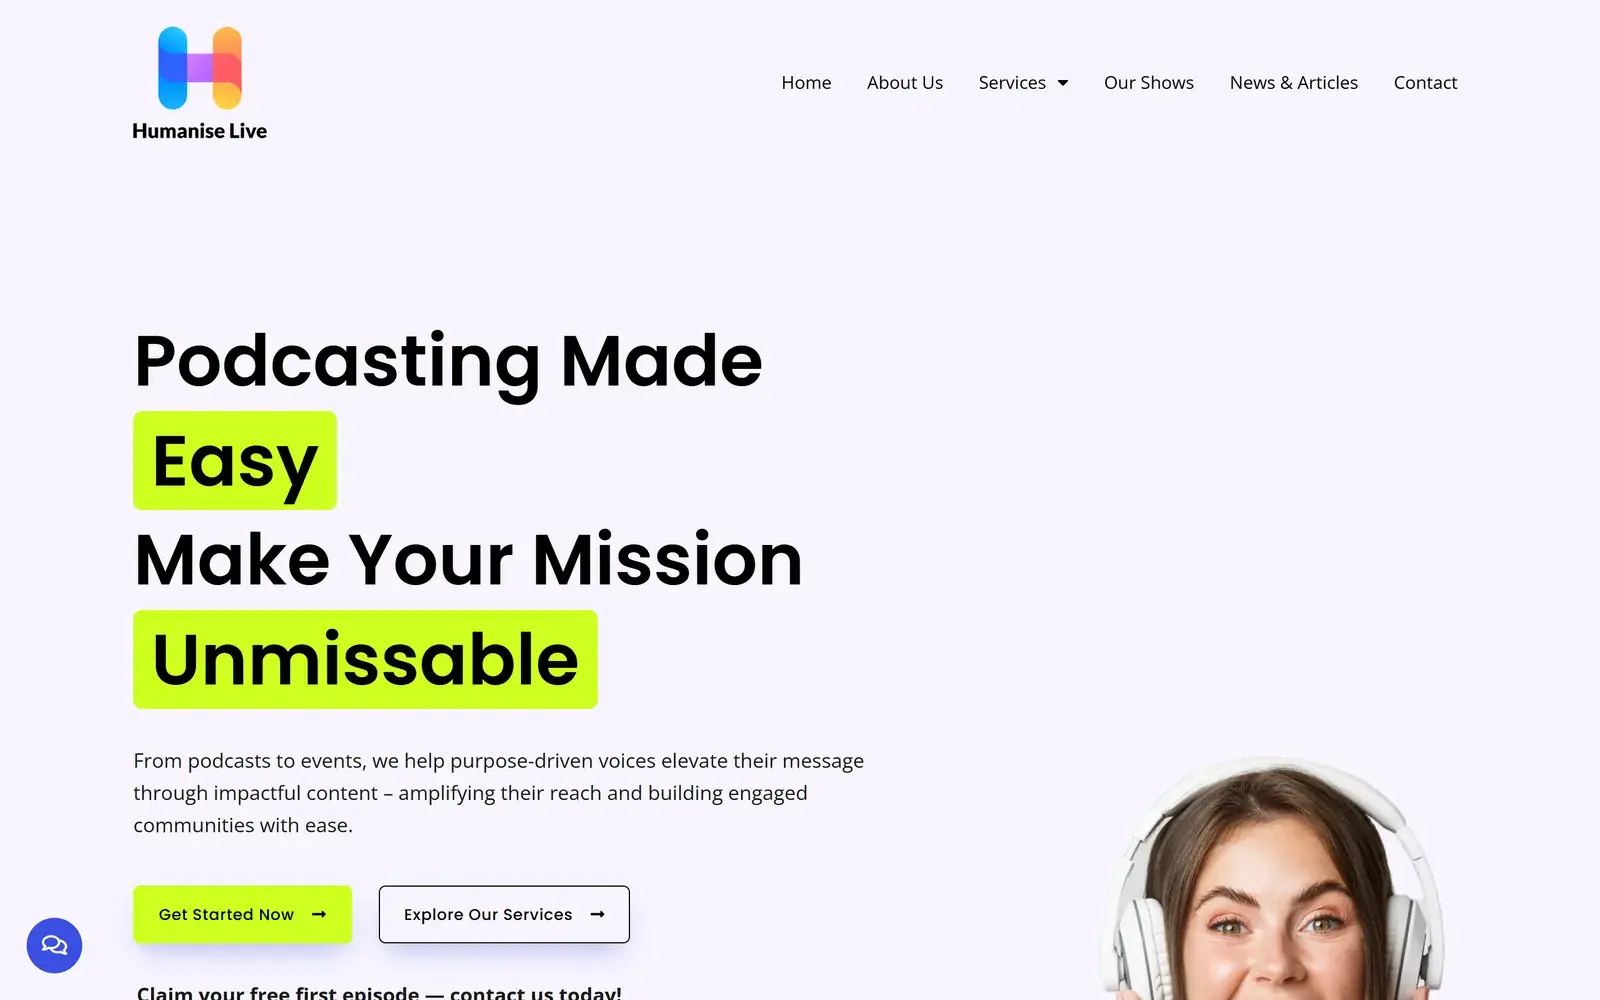
THE WORK
Onboarding first. Then the keyword library.
Taken from our project records and the client’s onboarding answers.
- 01July 2025
Onboarding
- Onboarding questionnaire completed 17 July 2025
- Services documented: podcast production, video and reels, event capture and livestream, speaker booking, content repurposing
- Audience and markets set: purpose-driven SMEs, charities and B2B teams, with a core focus on the UK, USA and Canada
- Webtec managing the website, with a blog to be launched with us
34 clicksin August 2025, the first full month on record and the baseline for this page - 02Dec 2025 – May 2026
Then we built the keyword library
- December: 80+ informational keywords across 10 categories, from a starting list of about 12
- February: 60+ long-tail keywords chosen for warmer buying intent, such as cost, ROI and outsourcing questions
- March and April: keyword clusters for host-selection content, an SEO and GEO article, and a guest-booking service page
- May: a gap analysis with 45+ new suggestions across 12 categories
2,477 → 39,691monthly impressions, December 2025 to May 2026, the span of this work
THE FULL RECORD
Month by month
Every month of the record, with its real numbers. Clicks peaked at 165 in May 2026, and every full month since March 2026 has passed 100. August is the headline month on this page because it is the latest full month.
| Month | Clicks | Impressions | Avg position |
|---|---|---|---|
| Jul 25 12 days | 16 | 96 | 11.3 |
| Aug 25 | 34 | 437 | 40.1 |
| Sep 25 Google change | 19 | 392 | 15.9 |
| Oct 25 | 25 | 511 | 10.6 |
| Nov 25 | 23 | 975 | 11.9 |
| Dec 25 Keyword library | 16 | 2,477 | 13.5 |
| Jan 26 | 37 | 2,863 | 12.8 |
| Feb 26 | 58 | 10,498 | 11.2 |
| Mar 26 | 107 | 26,722 | 8.4 |
| Apr 26 | 134 | 36,304 | 8.4 |
| May 26 Peak | 165 | 39,691 | 11.0 |
| Jun 26 Dip | 117 | 36,417 | 9.6 |
| Jul 26 | 132 | 34,741 | 10.4 |
| Aug 26 | 114 | 31,766 | 11.4 |
| Sep 26 19 days | 59 | 15,776 | 10.2 |
Google stopped serving 100 results per page in mid-September 2025. Impressions and average position before that point are not directly comparable with the months after it. Clicks were not affected in the same way.
What it added up to
From 34 clicks a month to 114, with every month accounted for
- 01 / 04Far more reach, on the same yardstickThe site was shown 91,620 times in the most recent 90 days, compared with 2,632 in the first 90 days after Google’s September 2025 change. Average position moved from 11.7 to 10.8 across the same windows.
- 02 / 04Clicks held above 100Every full month from March to August 2026 brought more than 100 clicks. No month before March reached 60.
- 03 / 04Articles carry the reachAcross the sixteen-month export, the page on podcast topics to talk about earned 52,691 impressions and 237 clicks. The homepage earned 9,979 impressions.
- 04 / 04Measured the whole wayEvery figure here comes from Google Search Console, for every month on record, including the month Google changed how it counts. No modelling, no projections.
Your turn
Not sure which questions your buyers search before they get in touch?
We will pull your Search Console data, show you which pages are close to moving and which ones never will, and hand you the list. Free, and yours to keep whether you work with us or not.
Where the numbers come from
Figures: Google Search Console for humanise.live, July 2025 to September 2026, and Webtec project records.
- Clicks per month
- 114
- Impressions per month
- 31,766
- Clicks per 90 days
- 338
- Impressions per 90 days
- 91,620
More case studies