Clicks per month
1,871from 17 in August 2025, a 21-day partial period

We rebuilt moduulize.com, launched it on 20 September 2025, then worked the search foundation for a year. The site went from 183 ranking keywords to 7,997, and from average position 39.2 to 7.0. Here is every month of it, including the one that went backwards.
Where it started
In the 21 days captured in August 2025, moduulize.com averaged position 39.2. That is page four. Search Console recorded 17 clicks and 941 impressions. The keyword baseline below uses the verified first 90-day window.
The verified starting point
The result
Every figure comes from Google Search Console for moduulize.com. Nothing modelled, nothing extrapolated.
Clicks per month
1,871from 17 in August 2025, a 21-day partial period
Impressions per month
107,462from 941 in August 2025, a 21-day partial period
Average position
7.0July 2026, from 39.2 in the 21-day August 2025 period
Ranking keywords
7,997from 183 in the first 90 days
Keywords in the top 3
3,232from 9 in the first 90 days
Twelve-month total
7,797clicks, from 605,899 impressions
The month it turned
Average position was 31.9 in September 2025, the month the new site went live. In October, the first full month on the new build, it was 12.1. That is the strongest single fact in the record.
September 2025
31.9October 2025
12.1Month by month
Two measures, two charts. Clicks and position sit on different scales, so putting them on one axis would flatter the story.
August 2025 holds 21 days of data. August 2026 holds 9. Both are marked.
Jul 26: 1,871 clicks, 107,462 impressions, position 7.0.
Lower is better, so this axis is inverted. December 2025 got worse before it got better.
Jul 26: position 7.0, 1,871 clicks and 107,462 impressions.
Search footprint
Clicks are the outcome. The search footprint widened alongside them. This compares the first 90 days of the engagement against the most recent 90, measured in Search Console.
Keywords ranking
First 90 days compared with the most recent 90 days in Search Console.
In the top 10
In the top 3
Clicks per 90 days
A separate unit from the keyword bars: clicks recorded inside each 90-day window.
The three keyword measures share one scale, with 7,997 as the widest measure. Clicks are shown separately. First 90 days: 11 August to 9 November 2025. Most recent 90: 13 May to 11 August 2026.
Primary evidence
Google’s own report for the same twelve months.
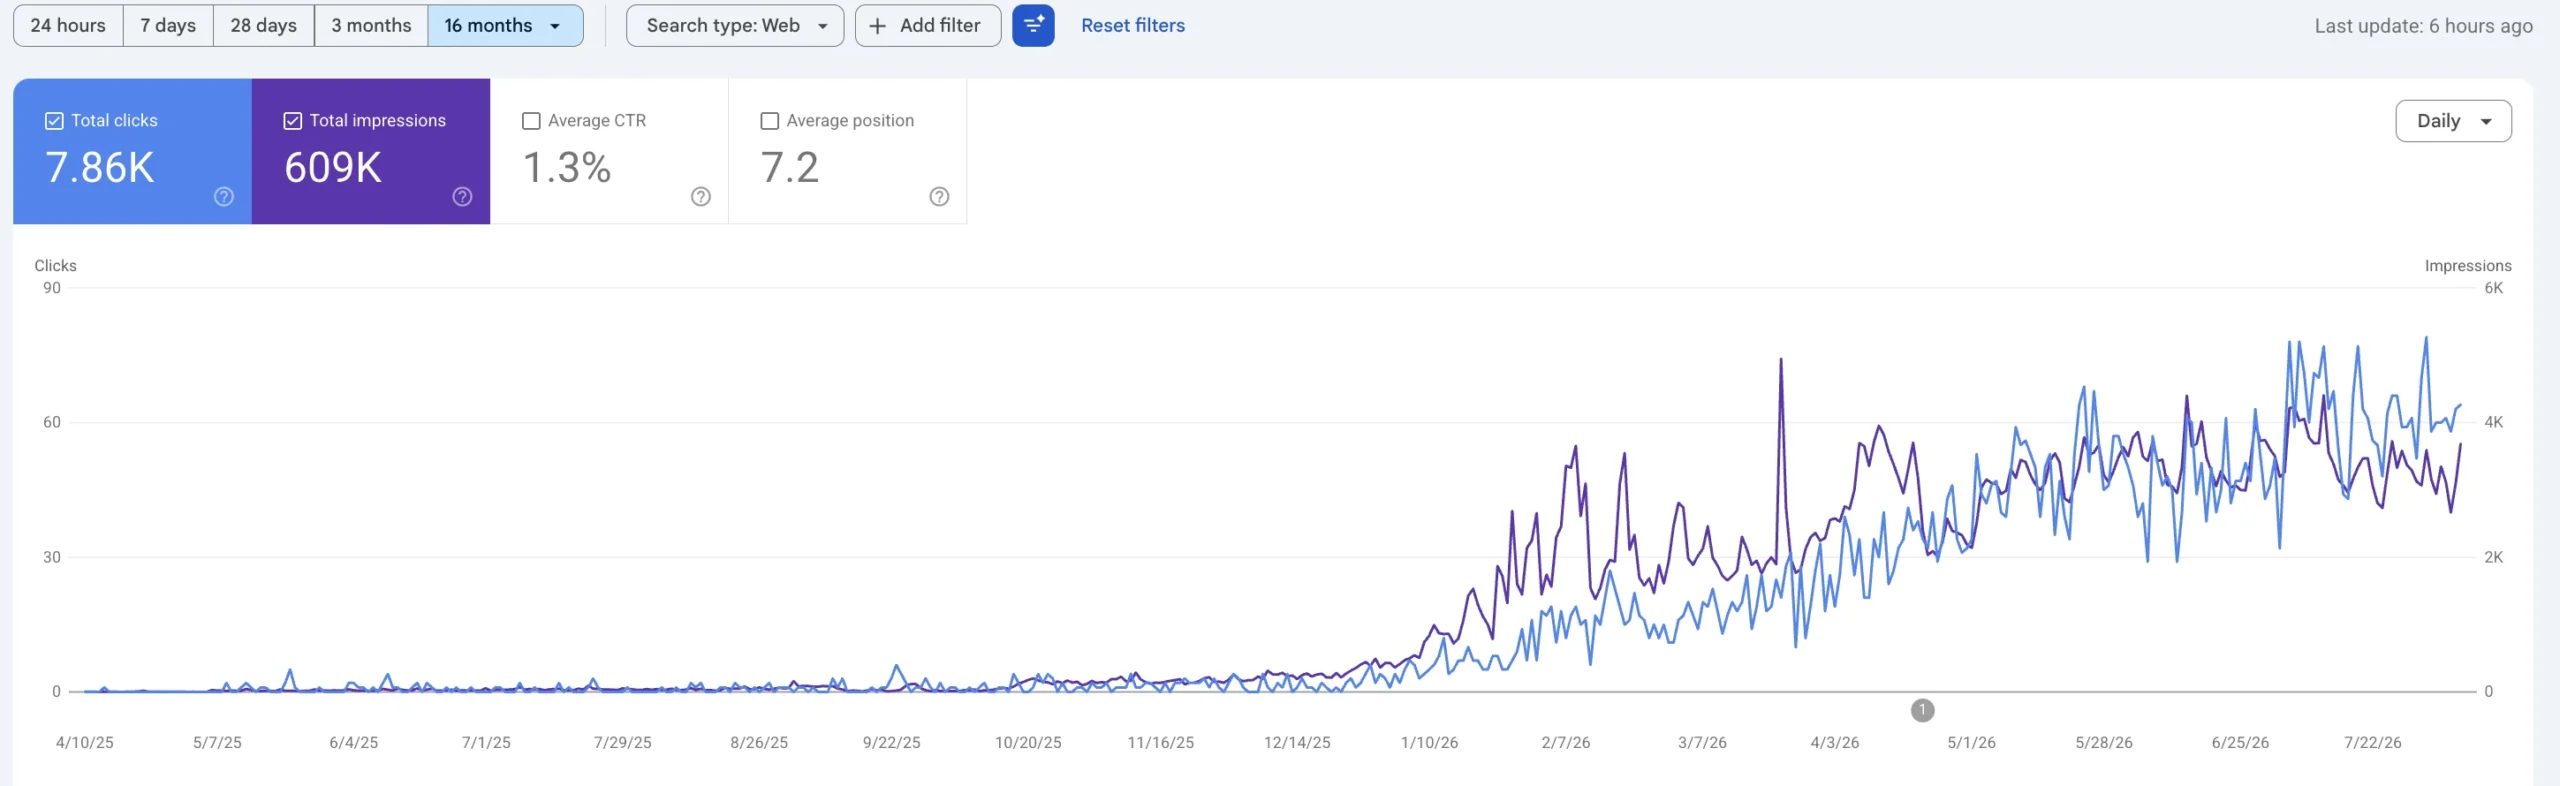
The work
Taken from our project records and work log.
Aug – Sept 2025
Technical SEO
The full record
December 2025 average position slipped to 16.5 before recovering. It is in the table because leaving it out would make the rest less believable.
| Month | Clicks | Impressions | Avg position |
|---|---|---|---|
| Aug 25 21 days | 17 | 941 | 39.2 |
| Sep 25 Live 20 Sept | 35 | 1,651 | 31.9 |
| Oct 25 | 34 | 2,580 | 12.1 |
| Nov 25 | 45 | 4,905 | 11.4 |
| Dec 25 Dip | 54 | 8,411 | 16.5 |
| Jan 26 | 202 | 33,583 | 9.2 |
| Feb 26 | 448 | 61,343 | 5.6 |
| Mar 26 | 619 | 67,369 | 5.7 |
| Apr 26 | 956 | 86,468 | 6.5 |
| May 26 | 1,525 | 98,825 | 7.4 |
| Jun 26 | 1,418 | 103,694 | 7.2 |
| Jul 26 | 1,871 | 107,462 | 7.0 |
| Aug 26 9 days | 573 | 28,667 | 6.8 |
What it added up to
The site appeared for 7,997 keywords in the most recent 90-day window, compared with 183 in the first 90 days.
3,232 keywords now sit in the top three. Ranking on page one is visibility. Ranking in the top three is where clicks actually happen.
Average position was 31.9 in the September launch month and 12.1 in October, the first full month on the new build. The timing is the signal here, not a claim of causation.
Every figure here comes from Google Search Console, including the month that went backwards. No modelling, no projections.